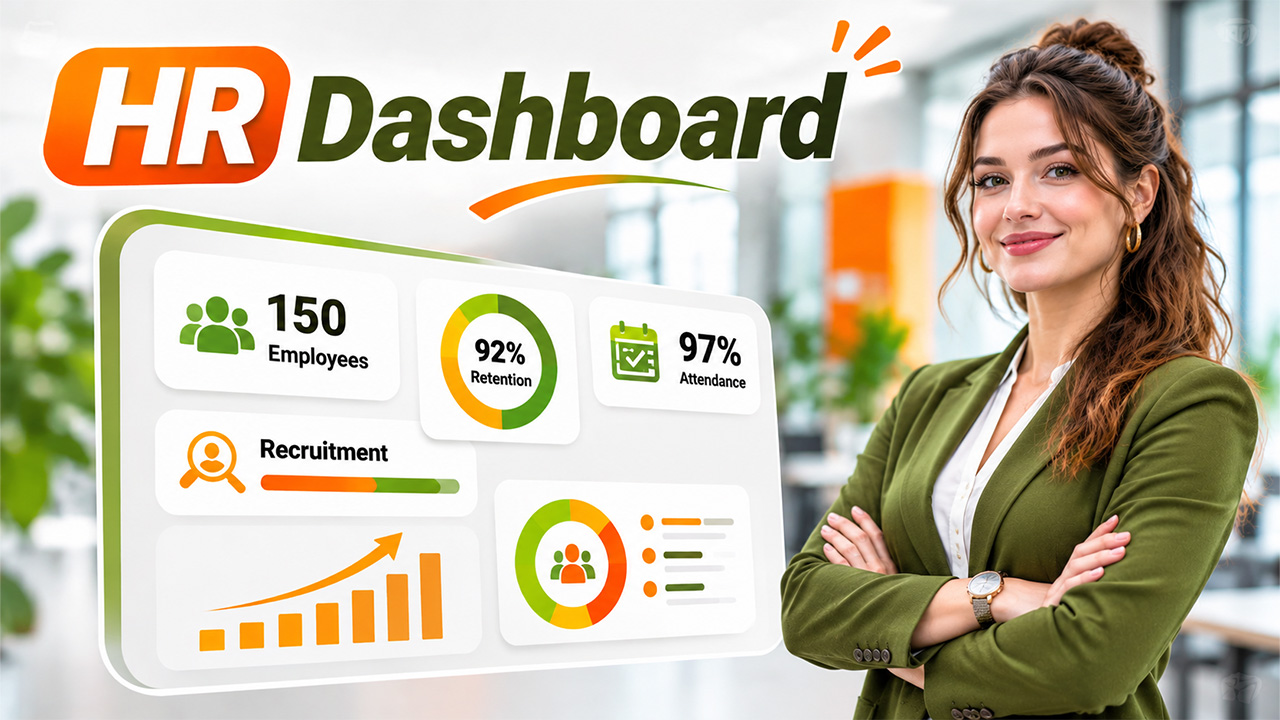

Imagine your company has 150 employees, but when management asks how many people left during the last quarter, which departments have the highest absenteeism, or whether recruitment is keeping pace with business growth, HR needs to check multiple spreadsheets and reports. Finding accurate answers takes time, and important workforce patterns can easily go unnoticed.
An HR dashboard brings these workforce details together in one place. Instead of reviewing disconnected reports, HR professionals can monitor employee performance, recruitment progress, attendance, retention, and other important metrics through a centralized view. More importantly, it helps managers understand what is happening across their workforce and make decisions based on reliable information.
Building an effective dashboard, however, involves more than displaying numbers and charts. It requires selecting meaningful metrics, organizing workforce data, and presenting information in a way that supports everyday HR decisions.
What Is an HR Dashboard?
An HR dashboard is a centralized reporting interface that collects and displays important human resource information. It helps HR teams monitor employee-related activities, identify workforce trends, and evaluate how effectively different HR processes are performing through HR analytics and reporting dashboards.
Depending on organizational requirements, it may include employee headcount, turnover rates, recruitment progress, attendance records, training participation, and performance indicators.
For example, if a company notices an increase in employee turnover, HR managers can examine department-wise attrition, employee tenure, and exit trends to understand where retention problems might exist.
An effective workforce dashboard presents this information in an understandable format, allowing decision-makers to move beyond basic reporting and investigate the reasons behind workforce changes.
Why Do Businesses Need an HR Dashboard?
Managing employee information through separate spreadsheets and departmental reports can make it difficult to maintain a consistent view of workforce performance. An HR dashboard simplifies this process by bringing relevant information together.
Some important advantages include:
- Better workforce visibility: Managers can monitor employee numbers, attendance, department distribution, and staffing changes without collecting multiple reports.
- Faster decision-making: Updated information helps HR teams respond to recruitment delays, attendance problems, and unexpected employee turnover.
- Improved workforce planning: Historical and current workforce information helps organizations identify staffing requirements and prepare for future hiring needs.
- Clear performance monitoring: HR teams can evaluate whether recruitment, training, and employee retention initiatives are achieving their intended objectives.
A well-organized dashboard also encourages collaboration between HR professionals and department managers because both can work with consistent workforce information.
How to Create an HR Dashboard: Step-by-Step Process
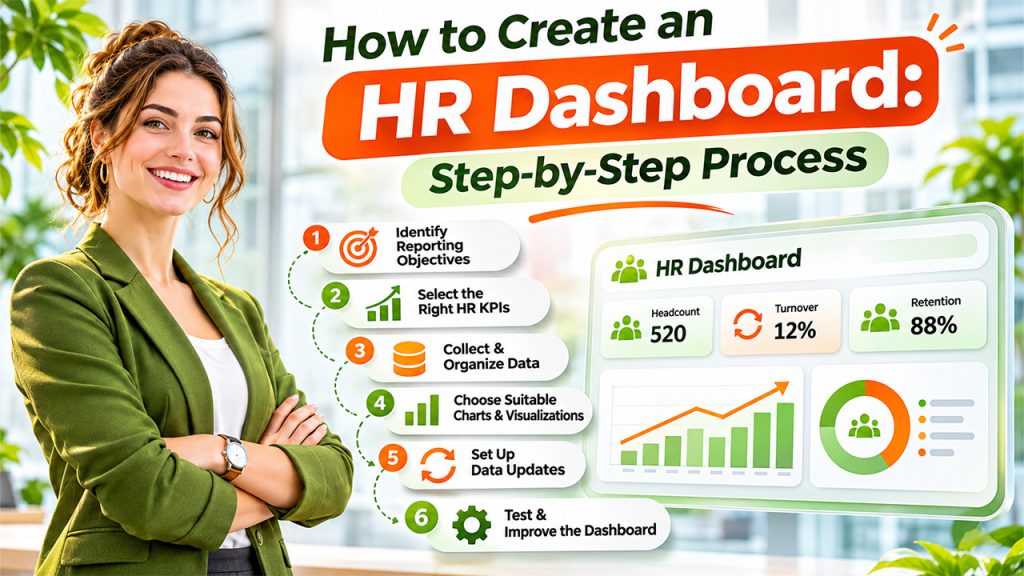
Creating a useful dashboard starts with understanding what the organization wants to measure. Adding every available employee metric can make reporting complicated, so each stage should have a clear purpose.
1. Identify Your HR Reporting Objectives
Start by identifying the workforce-related questions your dashboard should answer.
For example, a growing company might want to understand whether recruitment is keeping up with business expansion. Another organization may be more concerned about employee retention, absenteeism, or workforce productivity.
These objectives determine which information should appear on the dashboard.
If employee retention is a major concern, prioritize turnover rate, employee tenure, exit trends, and department-level attrition. If recruitment efficiency matters more, focus on open positions, time to hire, hiring sources, and offer acceptance rates.
Defining these objectives prevents unnecessary metrics from taking attention away from important business priorities.
2. Select the Right HR KPIs
Once reporting objectives are clear, identify the key performance indicators (KPIs) that can measure progress.
An HR KPI dashboard should focus on metrics that provide meaningful information about organizational performance rather than simply displaying available employee data.
Consider these commonly used HR metrics:
| HR KPI | What It Measures |
| Employee Headcount | Total number of active employees |
| Employee Turnover Rate | Percentage of employees leaving during a period |
| Absenteeism Rate | Frequency or proportion of employee absences |
| Time to Hire | Time taken to fill an open position |
| Employee Retention Rate | Percentage of employees retained over a period |
| Training Completion Rate | Percentage of employees completing assigned training |
The selection depends on business requirements. A recruitment-focused dashboard may need more hiring metrics, while an employee engagement dashboard may prioritize retention, satisfaction, and training participation.
3. Collect and Organize Workforce Data
An effective dashboard depends on accurate and consistent information. Employee data may come from HR management systems, payroll software, attendance platforms, recruitment tools, and performance management applications. Integrating these sources through a centralized HRMS platform helps organizations maintain employee records and streamline workforce data management.
Before connecting these sources, check whether employee records use consistent identifiers, department names, job titles, and reporting periods.
For example, if one system identifies a department as “Human Resources” while another uses “HR,” the dashboard may display them as separate departments.
A centralized data structure helps prevent duplicate records and inconsistent reporting. It also makes it easier to compare workforce information across different teams and periods.
4. Choose Suitable Charts and Visualizations
The purpose of visualization is to make workforce information easier to understand.
Different metrics require different presentation formats. A line chart can show how employee turnover changes over several months, while a bar chart can compare department-wise headcount.
A people analytics dashboard can also use filters to let managers examine information by department, location, employment type, or reporting period.
Avoid filling the interface with too many charts, colors, or decorative elements. Important information should be immediately visible, while additional details can remain accessible through filters or drill-down reports.
5. Set Up Real-Time or Scheduled Data Updates
Workforce information changes regularly as employees join, leave, change departments, or update their attendance records.
Decide how frequently the dashboard needs to refresh its information. Recruitment and attendance metrics may require frequent updates, whereas training reports and employee engagement summaries might be reviewed weekly or monthly.
Where possible, connect the dashboard directly to existing HR systems through integrations or APIs. This reduces manual data entry and helps maintain consistency.
However, real-time reporting is not necessary for every organization. The update schedule should match the importance and frequency of each metric.
6. Test and Improve the Dashboard
Before making the dashboard available to managers, verify that the displayed figures match the original data sources.
Check calculations, reporting dates, employee classifications, and department-level summaries. For instance, confirm that employees who left during a reporting period are not incorrectly included in active headcount.
Also, collect feedback from HR professionals and managers. They can identify missing information, confusing visualizations, or metrics that do not support their decisions. Incorporating user feedback into system improvements helps organizations refine reporting processes and make dashboards more useful.
Reviewing the dashboard regularly helps ensure that it remains useful as organizational priorities change.
HR Dashboard Examples: Metrics for Different Business Needs
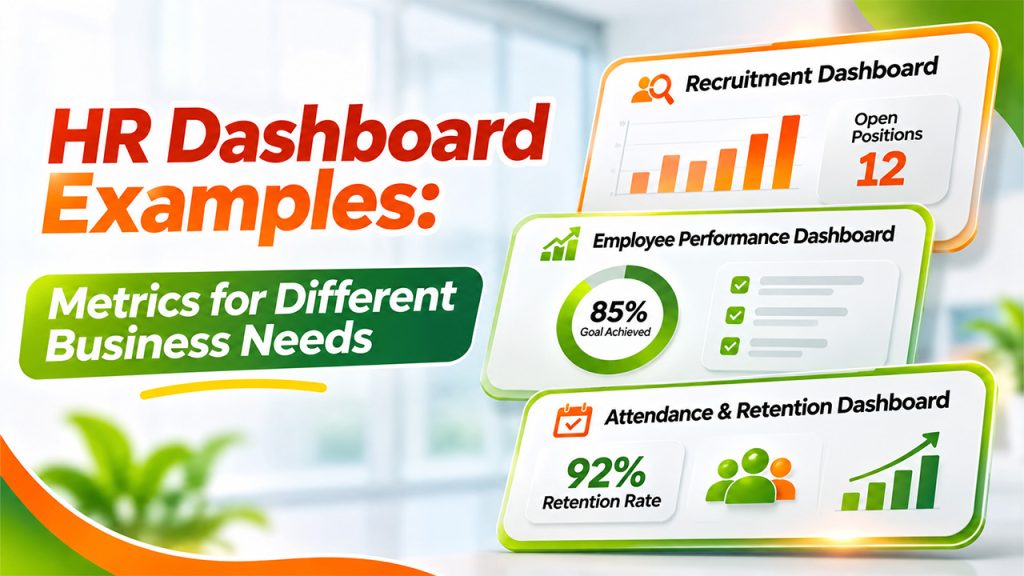
There is no single dashboard structure that works for every organization. The right design depends on the information managers need to monitor.
Here are some practical HR dashboard examples that businesses can consider.
1. Recruitment Dashboard
A recruitment dashboard helps hiring teams understand the progress of their recruitment activities. It can display open vacancies, applicants by hiring stage, interview conversion rates, time to hire, and offer acceptance rates.
For example, if several positions remain unfilled for an extended period, recruiters can examine where candidates are dropping out of the hiring process.
2. Employee Performance Dashboard
This dashboard focuses on employee performance, review completion, goal achievement, and training progress.
Managers can use these indicators to identify skill development requirements and understand whether employees are progressing toward their assigned objectives. Performance information should be interpreted alongside role expectations and other relevant context rather than treated as a standalone judgment.
3. Employee Attendance and Retention Dashboard
An attendance and retention dashboard tracks absenteeism, employee turnover, leave patterns, and retention rates.
For example, an increase in absenteeism within one department may encourage HR to investigate workload distribution, scheduling difficulties, or workplace concerns before the issue becomes more serious.
Common Mistakes to Avoid When Building an HR Dashboard
Even a well-designed dashboard can produce misleading information if its underlying data and reporting methods are not properly managed.
Some common mistakes include:
- Tracking too many KPIs: Excessive metrics make it harder to identify the information that actually matters.
- Using inconsistent data: Duplicate employee records or incorrect classifications can distort workforce reports.
- Ignoring data privacy: Employee information should only be accessible to authorized individuals according to organizational policies and applicable privacy requirements.
- Overlooking dashboard usability: Complicated layouts and unclear visualizations make reporting less effective.
- Failing to review metrics: Business priorities change, so dashboards should be evaluated and updated regularly.
Organizations should also distinguish between correlation and causation. For example, a department with higher employee turnover does not automatically indicate poor management. Additional investigation is needed before drawing conclusions.
Conclusion
An effective HR dashboard gives businesses a clearer understanding of their workforce by bringing important employee information into one accessible reporting environment. From recruitment and attendance to employee performance and retention, it helps HR professionals identify workforce trends, monitor organizational goals, and recognize areas that require attention.
The most useful approach is to start with specific business objectives, select relevant KPIs, maintain accurate workforce data, and present information through simple visualizations. As reporting requirements evolve, regular reviews and improvements will keep the dashboard aligned with organizational needs.
Ultimately, better workforce decisions come from understanding what the data actually represents and using those insights responsibly.
Frequently Asked Questions
What is an HR dashboard used for?
An HR dashboard is used to monitor workforce information, including employee headcount, recruitment, attendance, turnover, and performance. It gives HR professionals and managers a centralized view of important metrics, helping them identify workforce trends and make informed decisions.
What are the most important KPIs for an HR dashboard?
Common HR dashboard KPIs include employee turnover rate, retention rate, headcount, absenteeism rate, time to hire, and training completion rate. Businesses should select metrics according to their workforce priorities rather than tracking every available indicator.
What are some common HR dashboard examples?
Common examples include recruitment dashboards, employee performance dashboards, attendance dashboards, and workforce retention dashboards. Each focuses on a different HR function and presents relevant metrics to help managers understand specific workforce activities.
How does a workforce dashboard improve decision-making?
A workforce dashboard organizes employee information into understandable reports and visualizations. Managers can compare departments, monitor staffing changes, identify retention concerns, and evaluate recruitment performance, allowing them to investigate potential problems before making workforce decisions.
How often should an HR dashboard be updated?
The update frequency depends on the metrics being monitored. Recruitment and attendance information may require daily or frequent updates, while employee performance and training reports can be reviewed weekly or monthly. The reporting schedule should reflect business requirements and data availability.